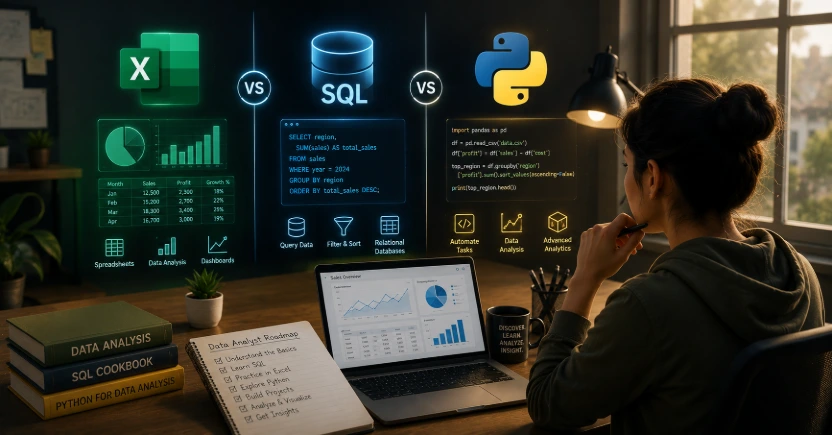
If you are looking to break into the tech industry without spending years learning complex software programming, Data Analytics is one of the most lucrative paths you can choose. Every major company in coastal Karnataka—from banking centers to growing e-commerce startups—is looking for professionals who can look at numbers and find trends that grow business revenue.
However, when a beginner starts researching the field, they are immediately hit with a wall of technical jargon. You will constantly hear that you need to master Microsoft Excel, learn SQL, and write code in Python.
This leads to a common trap that stalls many aspiring analysts in Mangalore: Which tool should I actually learn first, and how do they work together?
If you try to learn all of them simultaneously without a structured plan, you will end up overwhelmed. Let's break down the exact learning roadmap you should follow to become a job-ready Data Analyst this year.
Tool 1: Microsoft Excel (The Foundation)
Many people mistakenly assume Excel is outdated software meant only for basic office paperwork. In reality, Excel remains the most widely used data tool on the planet. It is the absolute best place for a beginner to start because it is highly visual.
What it does inline: Excel allows you to store, filter, clean, and visualize small to medium data sets using a point-and-click grid interface.
What you must master: You need to move past basic typing and learn Advanced Excel concepts like VLOOKUP, XLOOKUP, Index/Match, and Pivot Tables (which allow you to summarize thousands of rows of data in two clicks).
The Limitation: Excel starts lagging, freezing, or crashing entirely once your dataset grows past a few hundred thousand rows. That is when you need to step up your toolkit.
Tool 2: SQL (The Industry Non-Negotiable)
Once a company's data becomes too massive for Excel, they store it in digital warehouses called relational databases. Excel cannot talk to these databases. To get the data out, you must learn SQL (Structured Query Language used to communicate with and manage databases).
What it does inline: SQL allows you to write short, powerful text commands (queries) to pull specific information out of millions of rows of corporate data in seconds.
Why it's critical: If you look at tech job boards in India today, almost every single Data Analyst job description lists SQL as a mandatory requirement. If you cannot pull data out of a database, you cannot analyze it.
The Learning Curve: Surprisingly low! SQL uses simple, English-like commands (such as SELECT, FROM, and WHERE), making it incredibly easy for non-tech students to master.
Tool 3: Python (The Automation & Scaling Tool)
Once you can organize data in Excel and extract it using SQL, the final step to unlocking elite, high-paying tech roles is learning a programming language. Python is the global standard for data professionals.
What it does inline: Python allows you to write scripts that automate your daily work. If you have a boring task that takes three hours in Excel every morning, you can write a short Python script to finish it in three seconds.
Advanced Capabilities: Python uses specialized data libraries (like Pandas and NumPy) to clean messy data, perform complex statistical mathematics, and prepare data sets for advanced Artificial Intelligence (AI) tracking.
Do you need a coding background? No. Python is famous for having a clean, readable syntax that reads almost like standard English sentences, which is why it is the default language taught to beginners globally.
Step 1: Advanced Excel — Used to visually organize and clean smaller datasets.
Step 2: SQL Mastery — Essential for extracting data from massive corporate databases.
Step 3: Python Basics — Used to automate repetitive tasks and unlock elite tech roles.
The Strategic Learning Roadmap for Beginners
To make yourself job-ready without burning out, do not try to learn everything at once. Follow this logical sequence:
Weeks 1–2: Master Advanced Excel so you understand how data sets behave visually.
Weeks 3–5: Learn SQL so you can confidently talk to corporate databases and build portfolio projects.
Weeks 6+: Introduce basic Python to automate your workflows and learn data visualization dashboards like Power BI to present your findings to corporate managers.
Jumpstart Your Tech Career with Zen Institute
Trying to learn these data tools through random, disconnected internet tutorials can leave you with gaps in your practical knowledge. Employers don't hire people who have just memorized definitions; they hire people who can solve real problems on a tight deadline.
At Zen Institute Mangalore, our industry-vetted Data Analyst Course takes you from absolute ground zero up to an advanced portfolio level.
Taught entirely by elite mentors currently working at leading global MNCs, our program focuses on hands-on execution. You will build real interactive dashboards, write live SQL queries, and manage practical corporate datasets.
Along with industry-recognized certifications, every student receives comprehensive placement assistance—including professional resume design, portfolio reviews, and direct interview referrals to our hiring network.
The global demand for data skills is growing daily. Stop wondering where to start—join our next batch and build a future-proof tech career right here in Mangalore.
Frequently Asked Questions (FAQs)
1. Should I learn Excel, SQL, or Python first for Data Analytics?
For beginners, the recommended learning path is Excel → SQL → Python. Excel helps you understand and organize data, SQL teaches you how to retrieve data from databases, and Python helps automate tasks and perform advanced analysis.
2. Is SQL difficult for beginners to learn?
No. SQL has a simple, English-like syntax, making it one of the easiest programming languages for beginners. It is also a core skill required for most Data Analyst roles.
3. Do I need to know coding before learning Python?
No. Python is beginner-friendly and widely recommended as the first programming language for aspiring Data Analysts because of its simple and readable syntax.
4. Can I become a Data Analyst without an engineering or computer science degree?
Yes. Many Data Analysts come from commerce, science, arts, and other non-technical backgrounds. Practical skills, projects, and certifications are often more important than your degree.
5. Which tools are most important for a beginner Data Analyst?
The essential tools include Microsoft Excel, SQL, Python, and Power BI. Learning these tools provides a strong foundation for analyzing data and creating business insights.